一、Graphviz简介
Graphviz是一个可以在Linux、macOS、Windows和Solaris系统上使用的开源图表可视化工具,它能使你具备用文本画图的能力,画出来的图形可导出为图片、SVG、PDF等格式。使用Graphviz之前需要先安装,具体步骤参考官方文档:https://graphviz.gitlab.io/download/。提示:Mac系统使用`brew install graphviz`来安装,Windows系统则下载exe安装包进行安装,并且需要配置系统环境变量:
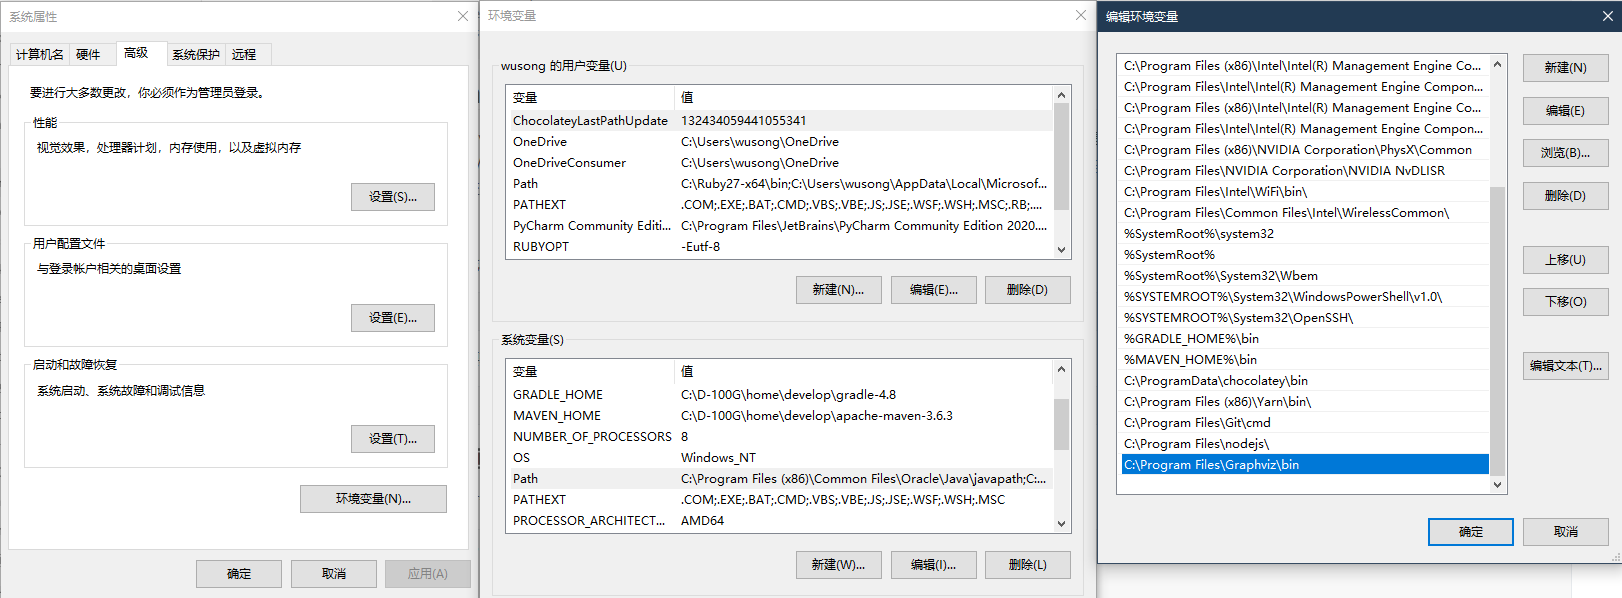
安装配置完成后,通过dot -version命令查看是否安装成功,成功会输出版本号等信息:

二、用命令行生成图片
现在,你可以在电脑上创建一个demo.dot文本,写入图形代码:
1
2
3
4
5
| graph simple
{
a -- b -- c;
b -- d;
}
|
在终端/命令行进入该.dot文件所在目录,通过命令把它转换为需要输出的格式:
1
| dot demo.dot –Tpng –o demo.png
|
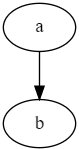
恭喜你!成功画了一个图!打开demo.png,你将会看到这个图:

如果要输出svg格式:
1
| dot demo.dot –Tsvg –o demo.svg
|
如果你使用VSCode编程,建议安装 Graphviz (dot) language support for Visual Studio Code 和 Graphviz Preview 插件:
二、使用dot语言画图
Demo1
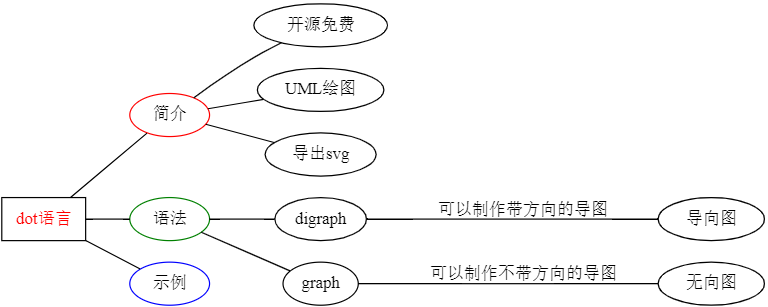
graph方法是使用没有箭头的线连接节点,你还可以更改图形方向、形状及文字格式,用Graphviz画思维导图:
1
2
3
4
5
6
7
8
9
10
11
12
| graph g {
rankdir=LR //方向左右
dot语言->{简介,语法,示例}
dot语言[shape=box,fontcolor=red]
简介[color=red]
语法[color=green]
示例[color=blue]
简介->{开源免费,UML绘图,导出svg}
语法->{"digraph","graph"}
"digraph"->导向图[label=可以制作带方向的导图]
"graph"->无向图[label=可以制作不带方向的导图]
}
|
Demo2
使用“digraph”画有箭头的线:
Demo3
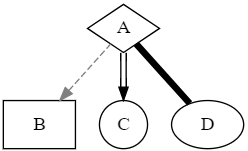
改变节点的形状和连接线样式:
1
2
3
4
5
6
7
8
9
10
11
| digraph D {
A [shape=diamond]
B [shape=box]
C [shape=circle]
A -> B [style=dashed, color=grey]
A -> C [color="black:invis:black"]
A -> D [penwidth=5, arrowhead=none]
}
|
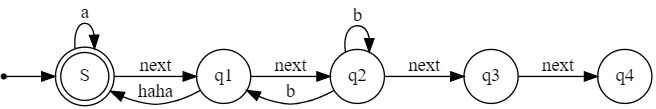
Demo4
可以用来画流程图:
1
2
3
4
5
6
7
8
9
10
11
12
13
14
15
16
17
18
| digraph finite_state_machine {
rankdir=LR;
size="8,5"
node [shape = doublecircle]; S;
node [shape = point ]; qi
node [shape = circle];
qi -> S;
S -> q1 [ label = "next" ];
S -> S [ label = "a" ];
q1 -> S [ label = "haha" ];
q1 -> q2 [ label = "next" ];
q2 -> q1 [ label = "b" ];
q2 -> q2 [ label = "b" ];
q2 -> q3 [ label = "next" ];
q3 -> q4 [ label = "next" ];
}
|
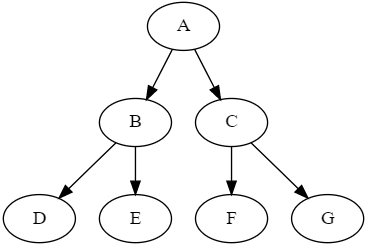
Demo5-1
一棵简单的二叉树:
1
2
3
4
5
| digraph D {
A -> {B,C}
B -> {D,E}
C -> {F,G}
}
|
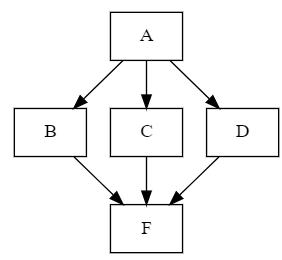
Demo5-2
别忘了节点形状是可以改变的:
1
2
3
4
| digraph D {
node [shape = box];
A -> {B, C, D} -> {F}
}
|
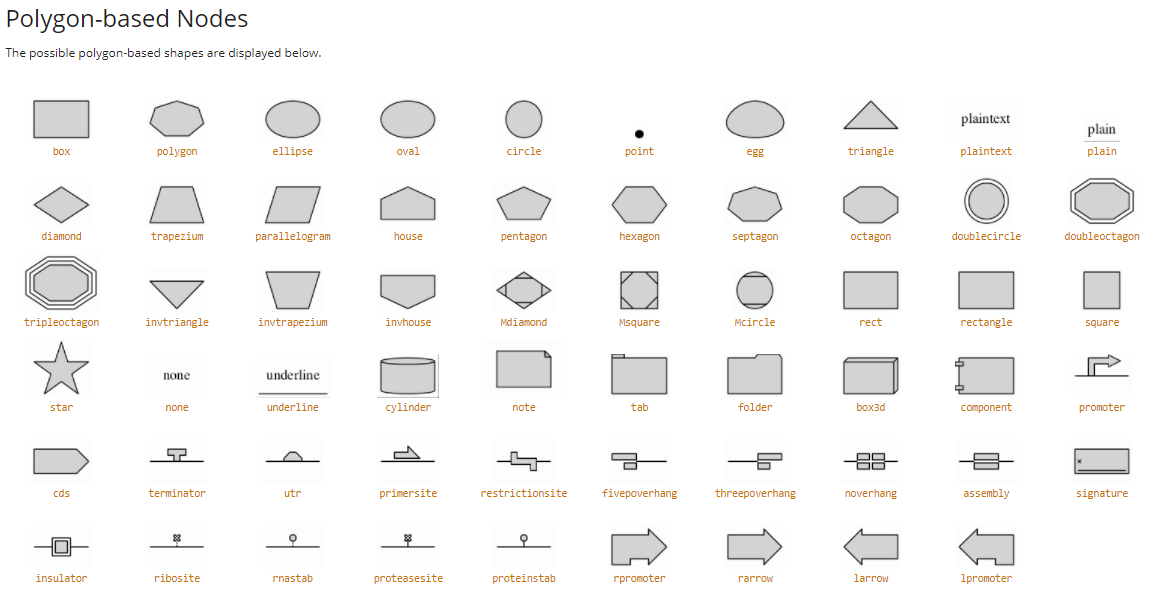
更多形状:
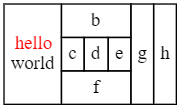
Demo6
用html画表格:
1
2
3
4
5
6
7
8
9
10
11
12
13
14
15
16
17
| digraph html{
mytable[shape = none, margin = 0, label = <
<TABLE BORDER = "0" CELLBORDER = "1" CELLSPACING = "0" CELLPADDING = "4">
<TR><TD ROWSPAN = "3"><FONT COLOR = "red">hello</FONT><BR/>world</TD>
<TD COLSPAN = "3">b</TD>
<TD ROWSPAN = "3">g</TD>
<TD ROWSPAN = "3">h</TD>
</TR>
<TR><TD>c</TD>
<TD PORT = "here">d</TD>
<TD>e</TD>
</TR>
<TR><TD COLSPAN = "3">f</TD>
</TR>
</TABLE>
>]
}
|
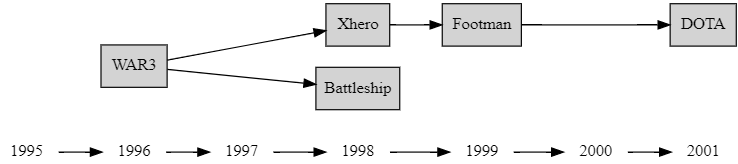
Demo7
使用rank把节点排列成对齐的行(列):
1
2
3
4
5
6
7
8
9
10
11
12
13
14
15
16
17
18
| digraph G{
rankdir = LR
{
node[shape = plaintext]
1995 -> 1996 -> 1997 -> 1998 -> 1999 -> 2000 -> 2001
}
{
node[shape = box, style = filled]
WAR3 -> Xhero -> Footman -> DOTA
WAR3 -> Battleship
}
{
{rank = same 1996 WAR3}
{rank = same 1998 Xhero Battleship}
{rank = same 1999 Footman}
{rank = same 2001 DOTA}
}
}
|
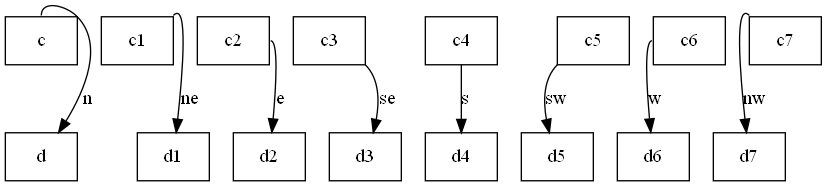
Demo8
用控制符”n”,”ne”,”e”,”se”,”s”,”sw”,”w”和”nw”指定连接线的起止位置:
1
2
3
4
5
6
7
8
9
10
11
| digraph G{
node[shape = box]
c:n -> d[label = n]
c1:ne -> d1[label = ne]
c2:e -> d2[label = e]
c3:se -> d3[label = se]
c4:s -> d4[label = s]
c5:sw -> d5[label = sw]
c6:w -> d6[label = w]
c7:nw -> d7[label = nw]
}
|
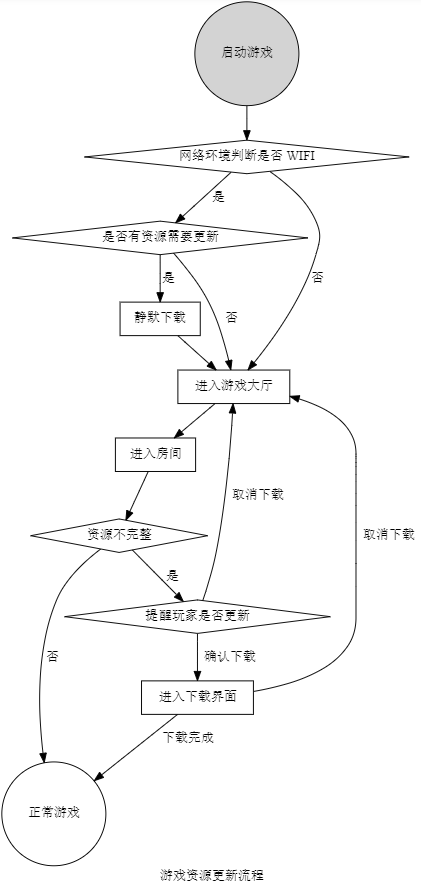
Demo9
画流程图
1
2
3
4
5
6
7
8
9
10
11
12
13
14
15
16
17
18
19
20
21
22
23
24
25
26
27
28
29
30
31
32
33
34
| digraph startgame {
label="游戏资源更新流程"
rankdir="TB"
start[label="启动游戏" shape=circle style=filled]
ifwifi[label="网络环境判断是否 WIFI" shape=diamond]
needupdate[label="是否有资源需要更新" shape=diamond]
startslientdl[label="静默下载" shape=box]
enterhall[label="进入游戏大厅" shape=box]
enterroom[label="进入房间" shape=box]
resourceuptodate[label="资源不完整" shape=diamond]
startplay[label="正常游戏" shape=circle fillcolor=blue]
warning[label="提醒玩家是否更新" shape=diamond]
startdl[label="进入下载界面" shape=box]
//{rank=same; needupdate, enterhall}
{shape=diamond; ifwifi, needupdate}
start -> ifwifi
ifwifi->needupdate[label="是"]
ifwifi->enterhall[label="否"]
needupdate->startslientdl[label="是"]
startslientdl->enterhall
needupdate->enterhall[label="否"]
enterhall -> enterroom
enterroom -> resourceuptodate
resourceuptodate -> warning[label="是"]
resourceuptodate -> startplay[label="否"]
warning -> startdl[label="确认下载"]
warning -> enterhall[label="取消下载"]
startdl -> enterhall[label="取消下载"]
startdl -> startplay[label="下载完成"]
}
|
如果要近一步学会使用Graphviz画图,你一定要浏览这个repo:https://github.com/huangz1990/redisbook1e-gallery
参考资料: